10. Derivatives and Tangent Lines
d. The First Derivative Test for Maxima and Minima
Local Maxima, Local Minima and Horizontal Inflection Points
A local maximum or a
relative maximum is a point where the function
value is larger than those at nearby points. At a local maximum, the curve
changes from increasing to decreasing. In other words, the derivative, or
slope, switches from positive to negative.
A local minimum or a relative minimum is a point where the function value is smaller than those at nearby points. At a local minimum, the curve changes from decreasing to increasing. In other words, the derivative, or slope, switches from negative to positive.
A local maximum or local minimum is also called a local extremum or a relative extremum.


At a local minimum or maximum, \(x=a\), the derivative changes sign and so \(f'(a)=0\) or \(f'(a)\) is undefined.
A critical point is a point \(x=a\) where \(f'(a)=0\) or \(f'(a)\) is undefined.
So to find the local maxima and minima, we find the critical points and test each one to see if it is a maximum or minimum. However, it is possible to have a critical point, \(x=a\), which is neither a maximum nor minimum. \(f'(a)=0\) means the curve is horizontal at \(x=a\), but it could be increasing on both sides or decreasing on both sides as shown in the plots.
A horizontal inflection point is a point \(x=a\) where \(f'(a)=0\) and the function is either increasing on both sides of \(x=a\) or decreasing on both sides of \(x=a\) as shown.
It is called an inflection point because the curve flexes from bending one way to bending the other way. There are also inflection points which are not horizontal and we will learn about them in the chapter on Higher Derivatives


The First Derivative Test
To summarize:
Suppose \(x=c\) is a critical point of \(f(x)\) where \(f'(c)=0\). Then
-
If \(f'(x) < 0\) for \(x < c\) and \(f'(x) > 0\) for \(x > c\),
then the critical point \(c\) is a
local minimum.
This says \(f\) is decreasing on the left and increasing on the right of \(c\). -
If \(f'(x) > 0\) for \(x < c\) and \(f'(x) < 0\) for \(x > c\),
then the critical point \(c\) is a
local maximum.
This says \(f\) is increasing on the left and decreasing on the right of \(c\). -
If \(f'(x) < 0\) for \(x < c\) and \(x > c\)
or \(f'(x) > 0\) for \(x < c\) and \(x > c\),
then the critical point \(c\) is a
horizontal inflection point.
This says \(f\) is decreasing on the left and right of \(c\) or increasing on the left and right of \(c\).
When we specify the sign of \(f'\) on \(x < c\) and \(x > c\), we actually mean that there is some interval around \(c\) within which these conditions on \(f'\) hold. For local extrema, we don't care what happens far away from \(c\).
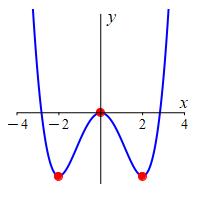
Find the local maxima, local minima and horizontal inflection points of the graph of \(f(x)=x^4-8x^2\).
In an example on a
previous page we found the
derivative and factored it:
\[
f'(x)=4x^3-16x=4x(x-2)(x+2)
\]
We saw the critical points are at \(x=-2,0,2\).Further, the derivative
is negative on \((-\infty,-2)\) and \((0,2)\) and is positive on \((-2,0)\)
and \((2,\infty)\).
Then we drew a number line, marked the critical points, where the derivative
is positive and negative and where the function is increasing or decreasing:

By the First Derivative Test, \(f(x)\) has a local minimum at \(x=-2\) where the value is \[ f(-2)=(-2)^4-8(-2)^2=-16 \] Similarly, \(f(x)\) has a local maximum at \(x=0\) where the value is \[ f(0)=(0)^4-8(0)^2=0 \] and \(f(x)\) has a local minimum at \(x=2\) where the value is \[ f(2)=(2)^4-8(2)^2=-16 \] Its plot is shown.
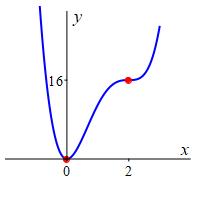
Find the local maxima, local minima and horizontal inflection points of the graph of \(f(x)=3x^4-16x^3+24x^2\). This graph was previously discussed in an exercise on a previous page.
Factor the derivative. Find the critical points and determine where the derivative is positive and negative.
\(f(x)\) has a local minimum at \(x=0\), no local maxima, and a horizontal inflection point at \(x=2\).
In an exercise on a
previous page we found the
derivative and factored it:
\[
f'(x)=12x^3-48x^2+48x=12x(x-2)^2
\]
So the critical points are at \(x=0\) and \(x=2\). Further, the derivative
is negative for \(x \lt 0\) and positive for \(x \gt 0\).
Then we drew a number line and marked the critical points, where the
derivative is positive and negative, and where the function is increasing
or decreasing:

By the First Derivative Test, \(f(x)\) has a local minimum at \(x=0\) where the value is \[ f(0)=3(0)^4-16(0)^3+24(0)^2=0 \] and \(f(x)\) has a horizontal inflection point at \(x=2\) where the value is \[ f(2)=3(2)^4-16(2)^3+24(2)^2=16 \] Here is the plot.
Heading
Placeholder text: Lorem ipsum Lorem ipsum Lorem ipsum Lorem ipsum Lorem ipsum Lorem ipsum Lorem ipsum Lorem ipsum Lorem ipsum Lorem ipsum Lorem ipsum Lorem ipsum Lorem ipsum Lorem ipsum Lorem ipsum Lorem ipsum Lorem ipsum Lorem ipsum Lorem ipsum Lorem ipsum Lorem ipsum Lorem ipsum Lorem ipsum Lorem ipsum Lorem ipsum